

Rolling Out
▸
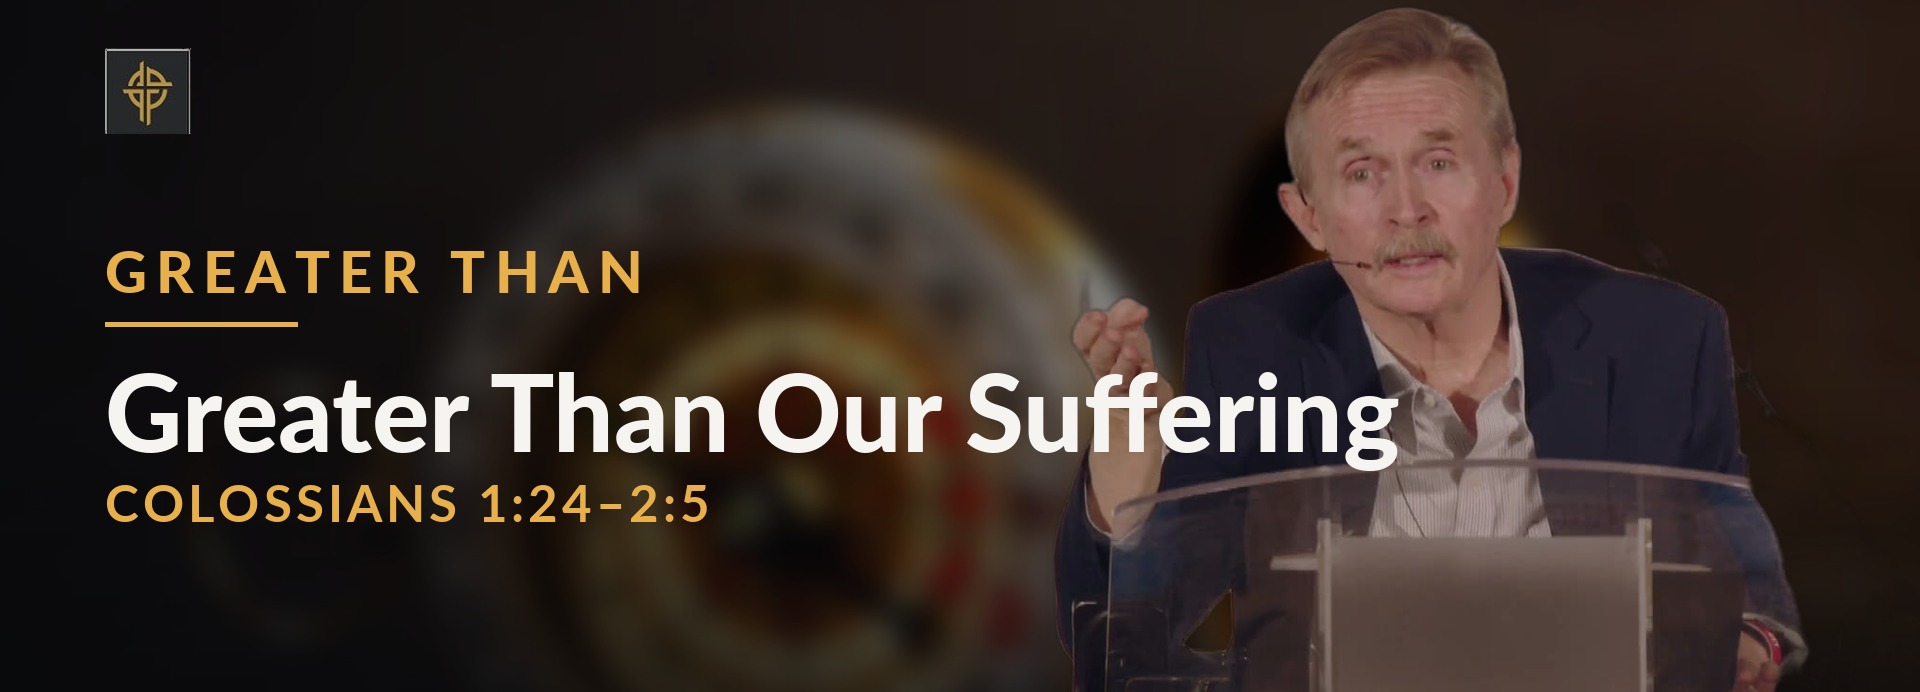
- 📖 Sun — LIVE: Greater Than Our Suffering (Kent Keller — Colossians 1:24-2:5 · GREATER THAN series · Week 3)
- 🌐 The new christchurchmiami.org goes live Wednesday 7/29 — off Subsplash entirely
- 📝 Sermon blog + a field devotional at christchurchmiami.org/blog
View 3 more ▾
- 🎬 Fresh Shorts cut from this Sunday — the 07-19 clips were retired unposted
- 📱 Mon–Fri devotionals Day 1–5 (Colossians 1:24-2:5)
- 🇪🇸 Spanish sermon, page and study guide — same-day
Snapshot
▸
 View sermon details ▾
Kent Keller · Colossians 1:24-2:5 · Sunday, July 26, 2026
Which way is true north? Pastor Kent Keller asks a room full of people to point, and gets a scattering of opinions — which is roughly how most of us navigate suffering. In Colossians 1:24-2:5, Paul writes from prison and calls his own suffering necessary: not because Christ's atonement was somehow insufficient, but because God put him where he could write the letters that have ministered to the church for two thousand years. Viktor Frankl, who survived Auschwitz, put it this way — a man can endure almost any "what" as long as he has a "why." Paul's why is the mystery God kept hidden and has now revealed: Christ in you, the hope of glory. The goal of all of it is to present every believer mature in Christ, firmly rooted in the truth.
Devotionals
▸
Each card drops at 12:05 AM ET on its day; full bodies live in the app.cm devotionals rotation.
Blogs This Week
▸
-
 Greater Than Our Suffering — Sermon Social Drop
 -
 Greater Than Our Suffering — Blog Social Drop
Last Week's Pulse
▸
Per-sermon lifetime views by Sunday across all five surfaces — each point is one sermon (date · speaker). YouTube = views; Subsplash = plays. Lifetime totals, not weekly deltas. The gold band (0–50) is shown at 2× vertical scale so the low-volume surfaces have room for detail; above the dotted line the scale returns to normal (1:1).
† Jul 26 = live viewing only (newest sermon; on-demand views still accruing).
What Worked / What to Watch
▸
🟢 ✅ Engagement recovered. 56.5% → 59.8% on a much smaller audience. When the volume dropped away, the people who remained went deeper — the opposite of what a traffic decline usually looks like.
🟢 ⏱ YouTube retention more than doubled. 6.3% → 13.2%. With no new Shorts, the views the channel did get came to the back catalogue and stayed.
🟢 ⏸ The stale Shorts were caught before they posted. Nine days late would have read as old. Skipping them was the right call, and each row carries its reason in the record rather than vanishing silently.
🟢 🚀 Launch week was ready. The new christchurchmiami.org went live the following Wednesday, off Subsplash entirely.
🟡 📉 A full week with no social output. Zero Stories, zero Shorts. The traffic decline — users down 26%, sessions down 32% — is the honest cost of that, and it makes a clean baseline for reading the launch week that follows.
🟡 ⚡ Two weeks without a Short posting. Different causes — stranded the first week, deliberately skipped the second — but the audience experienced one continuous silence. Worth watching how quickly views recover once the cadence resumes.
🟡 ✉️ Mailchimp and Instagram remain hand-read. Neither is an authenticated Supermetrics source here.
Note from Jeff
▸
The Shorts from the 19th had gone nine days late by the time they would have posted. Nine days is long enough that they stop feeling like this week's message and start feeling like something we forgot about, so we skipped them rather than push stale clips. That meant a full week with nothing going out on Instagram or YouTube, and the traffic reflects it — users and sessions both down sharply.
What I would not want lost in that is the other half. Engagement went up. YouTube retention doubled. The smaller audience was a more attentive one. That is a reasonable place to be standing the week before a site launch, and it gives us a clean line to measure the launch against. — Jeff
This Week on IG — Scheduled
▸


Complete Service
▸
Worship, liturgy and the sermon, unedited — the whole Sunday for anyone who could not be in the room.

Running order — pulled from Planning Center and timed against the recording.
- 0:00Call to Worship
- 4:46Praise You Anywhere
- 7:39Raise A Hallelujah
- 14:54I Speak Jesus
- 20:07Greeting Time
- 27:45Scripture Reading
- 30:45Sermon
- 65:12Faithfulness
- 70:07Benediction
- 71:08Doxology
On the site: https://christchurchmiami.org/complete-services/2026-07-26-greater-than-our-suffering/
Open Items
▸
- ⏸ Eight posts skipped by decision — the 07-19 Shorts were nine days stale; reason logged on every row.
- ⚡ Two consecutive weeks without a Short posting — different causes, one continuous silence from the audience's side.
- 📧 Mailchimp (open tile) — no Supermetrics source connected here.
- 📱 Instagram (open tile) — account-level figures hand-read from the IG dashboard.
- 🎨 hero_asset (`bg-compass.jpg`) — the compass image behind the hero gradient, matching the true-north opening.